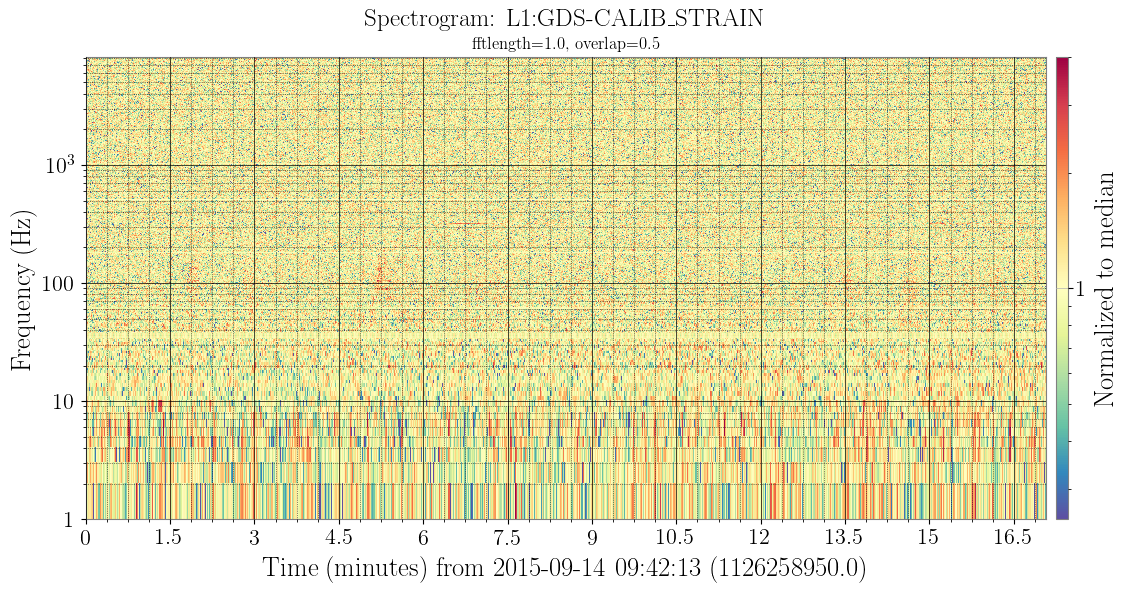
Normalised spectrogram
$ gwpy-plot spectrogram \
    --chan L1:GDS-CALIB_STRAIN \
    --start 1126258950 \
    --duration 1024 \
    --norm \
    --cmap Spectral_r \
    --imin .25 \
    --imax 4 \
    --interactive

$ gwpy-plot spectrogram \
--chan L1:GDS-CALIB_STRAIN \
--start 1126258950 \
--duration 1024 \
--norm \
--cmap Spectral_r \
--imin .25 \
--imax 4 \
--interactive
